Published on
Even as the supply and demand gap continues to close, national rent growth has remained mostly unchanged, around 1 percent, according to the latest CoStar data for the second quarter. Asking rent growth averaged 0.9 percent year over year, while the vacancy rate continued to hold steady at 8.1 percent.
Supply–demand gap narrows
The second quarter saw the addition of 175,655 new units — an 11 percent drop year over year.
Construction starts have been on a downward trend for the past two years, and new supply in 2025 is expected to continue to fall by 30 percent from last year’s record high. A total of 485,000 new units are projected to be delivered this year.
At the same time, demand has remained strong. With 151,440 units of absorption in the second quarter, the supply–demand gap has continued to narrow.
Rent growth and vacancy remain stable at the national level
Year-over-year rent growth has hovered around the 1-percent mark for the last two years. This followed a rapid fall in 2022 from pandemic-era highs. In the second quarter, this trend continues, with only a slight deceleration, as rent growth fell to 0.9 percent.
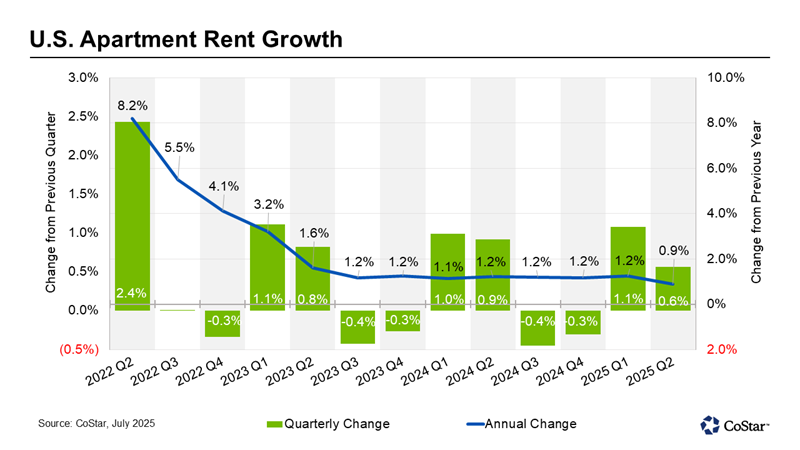
At the same time, the national vacancy rate has also plateaued. Multifamily vacancy nationwide has averaged around 8 percent for the last four quarters. In the second quarter, it stayed unchanged at 8.1 percent.
Luxury apartments face brunt of excess supply
High-end multifamily properties have faced the greatest gap between supply and demand. Even as 75 percent of units absorbed were among this class — known in the CoStar rating system as four- and five-star buildings — these properties have also made up the bulk of new supply.
As a result, four- and five-star properties have seen the slowest rent growth of all the quality classes. Asking rents for these properties grew by only 0.5 percent, while the vacancy rate has remained in double digits, at 11.5 percent.
In contrast, mid-priced properties, known as three-star buildings, slightly outperformed the national average with 1.1 percent rent growth, and they faced a vacancy rate of only 7.5 percent.
2 California markets join the Midwest and Northeast as rent growth leaders
Over the past few years, rent growth has remained the strongest in the Midwest and Northeast regions, where supply and demand have been relatively balanced, thanks to limited construction. In contrast, the Sun Belt region, which saw a rapid rise in development, has faced lagging and even negative rent growth.
In the second quarter, two markets from the West shot up the rent growth charts. San Francisco and San Jose, both in California’s Bay Area, ranked first and third, with 5.1 percent and 3 percent rent growth, respectively.
These markets, where development has also been notoriously limited, have benefited from a recent rise in demand, driving up rents in the #1 and #3 most expensive rental markets. Quality-of-life improvements and the artificial intelligence boom in these tech-heavy markets have helped increase demand.
The second most expensive market, New York, where development is also limited, ranked seventh for rent growth at 2.5 percent.
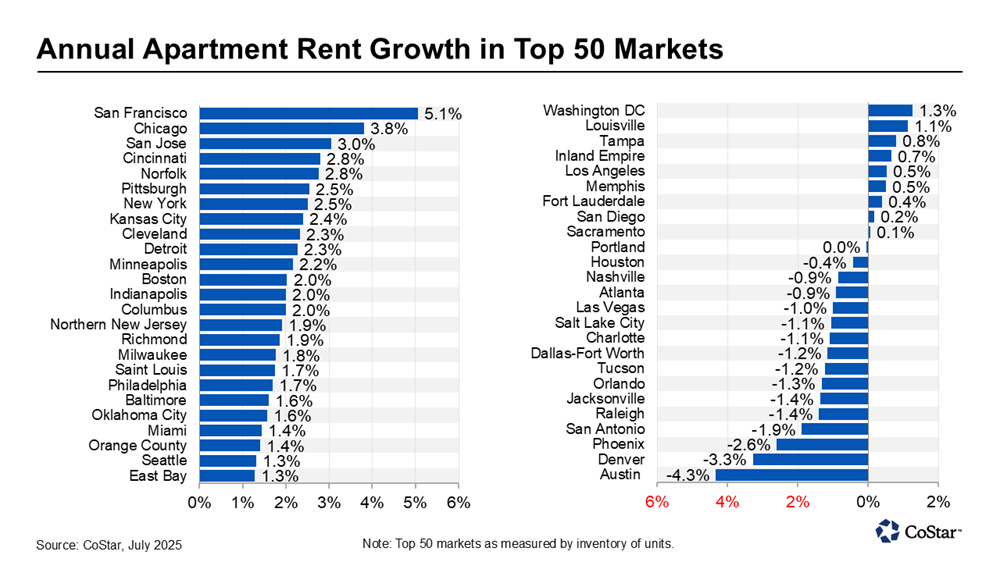
Rounding out the top 10 were major markets across the Midwest and Northeast.
Chicago led the Midwest with 3.8 percent, followed by Cincinnati (2.8 percent), Kansas City (2.4 percent), Cleveland (2.3 percent), and Detroit (2.3 percent).
In the Northeast region, Norfolk posted 2.8 percent, followed by Pittsburgh and New York at 2.5 percent.
Oversupplied Sun Belt markets still see declining rents

At the other end of the spectrum, all but two of the 15 markets with declining rents were in the Sun Belt.
Austin continued to see the greatest declines nationwide, posting negative 4.3 percent rent growth. Between 2021 and 2023, development in the Texas capital increased by more than three and a half times its pre-pandemic average. This explosion of new supply continues to outpace demand. Austin has remained in the bottom spot for rent growth for eight consecutive quarters.
Austin was followed by Denver — one of only two markets outside the Sun Belt with negative rent growth — where rents fell by 3.3 percent, maintaining Denver’s position as the second worst-performing market for rent growth for the second quarter in a row.
Denver has added 45,000 multifamily units in the last five years. This increase in supply has overwhelmed demand, even as Colorado has benefited from out-of-state migration.
Also in the bottom 10 markets were Phoenix (-2.6 percent), San Antonio (-1.9 percent), Raleigh (-1.4 percent), Jacksonville (-1.4 percent), Orlando (-1.3 percent), Tucson (-1.2 percent), Dallas-Fort Worth (-1.2 percent), and Charlotte (-1.1 percent).
What’s ahead for the multifamily market?
Join an upcoming webinar to discover more market insights. CoStar’s Connor Devereux will analyze the first half of 2025 and share the latest multifamily outlook for the quarters ahead.